
If you’ve spent any time on YouTube exploring mathematics, you’ve almost certainly encountered 3Blue1Brown. The channel, created by Grant Sanderson, has become the gold standard for mathematical visualization—taking concepts from linear algebra, calculus, neural networks, and beyond, and making them genuinely intuitive through stunning animated explanations. With over six million subscribers, it’s arguably done more to make advanced math accessible than any traditional educational resource.
But here’s the question viewers inevitably ask: How does he make those animations?
About a year ago, Grant sat down with Ben Sparks (a mathematician known for his Numberphile appearances) and walked through his custom Python library called Manim—from a basic hello world to animating the famous Lorenz Attractor. If you’ve ever been captivated by those smooth transforms, elegant equations, and perfectly-timed visual explanations—this is how the sausage gets made.
This is Part 1 of a two-part series. Here, we’ll explore what Manim is, how Grant uses it, and why it represents a fundamentally different approach to creating educational content. In Part 2, we’ll show you how to leverage AI tools like Claude to actually use this library—even if you’re not a Python expert.
What Is Manim?
Manim (Mathematical Animation Engine) is Grant Sanderson’s custom Python library for creating precise, programmatic mathematical animations. Unlike traditional animation software where you drag keyframes around a timeline, Manim treats animations as code. You write Python, and the library renders your mathematical objects, transformations, and transitions into polished video.
The key insight: mathematics is already expressed in formal notation. Why translate it into a visual medium using imprecise manual tools when you can express the visuals as precisely as the math itself?
Here’s what a basic Manim scene looks like:
class HelloWorld(Scene):
    def construct(self):
        circle = Circle()
        square = Square()
        text = Text("Hello World")

        self.add(circle, square)
        self.play(Write(text))
That’s it. A few lines of Python, and you have shapes on screen with animated text being “written” in that signature 3Blue1Brown style. The Write animation—that edge-tracing effect you’ve seen in hundreds of math videos—is just a function call.
Two Versions: Choose Your Adventure
There’s an important fork in the Manim road that Grant addresses upfront: there are actually two versions of the library.
Grant’s personal version is the original, continuously evolved alongside the channel. It’s highly optimized for his specific workflow, includes experimental features like interactive development, and powers every video you’ve watched. But it’s also bespoke—not designed for broad community use.
Manim Community is a fork maintained by developers who wanted a more robust, well-documented, and tested version for general use. It has better documentation, proper issue tracking, and is generally recommended for newcomers.
Grant’s honest about it: “I don’t, as a personality type, really have the constitution to manage an open source project.” The community version exists because people who wanted to use Manim also wanted it to be properly maintained. Both versions share the same core philosophy, but if you’re starting out, Manim Community is the safer bet.
The Interactive Workflow That Changes Everything
The most revealing part of the demonstration isn’t the code—it’s the workflow.
Grant’s setup involves a text editor (Sublime Text) with a live Python terminal connected to the scene. This means he can highlight a line of code, press a keyboard shortcut, and immediately see the result rendered on screen. No waiting for full video renders. No tedious compile-test cycles.
This matters more than it might seem. Traditional animation workflows are notoriously slow: make a change, render, watch, adjust, repeat. Grant’s interactive approach means he can experiment in real-time. Want to see what happens if you change the color? Adjust the timing? Move an object? Highlight, run, see.
He’s also built a “checkpoint paste” system that essentially gives him notebook-like functionality within a plain text file. When working on a long scene (some of his videos have thousands of lines of code), he can jump to any section, run just that part, and iterate without re-running everything from the beginning.
This is the kind of tooling that separates “technically possible” from “actually practical for daily use.”
Everything Transforms Into Everything
One of Manim’s philosophical pillars is universal transformation. Any mathematical object can smoothly morph into any other.
In the demo, Grant takes the letter “H” from a text object and transforms it into a circle. The letter literally morphs—curves adjusting, points interpolating—into a completely different shape. This isn’t a fade-out/fade-in trick. It’s a genuine geometric transformation where the library figures out how to smoothly interpolate between two different sets of points.
This capability is pedagogically powerful. Mathematical concepts often involve showing how one thing relates to another—how a function transforms under different conditions, how a geometric proof connects disparate shapes, how an equation can be rearranged. Manim makes these connections visible in a way that static diagrams simply cannot.
The transformation system also includes intelligent string matching. If you’re animating an equation being rearranged, Manim can automatically match symbols: the A² in the first expression smoothly moves to become the A² in the rearranged form. What would take hours of manual keyframing becomes a single line of code.
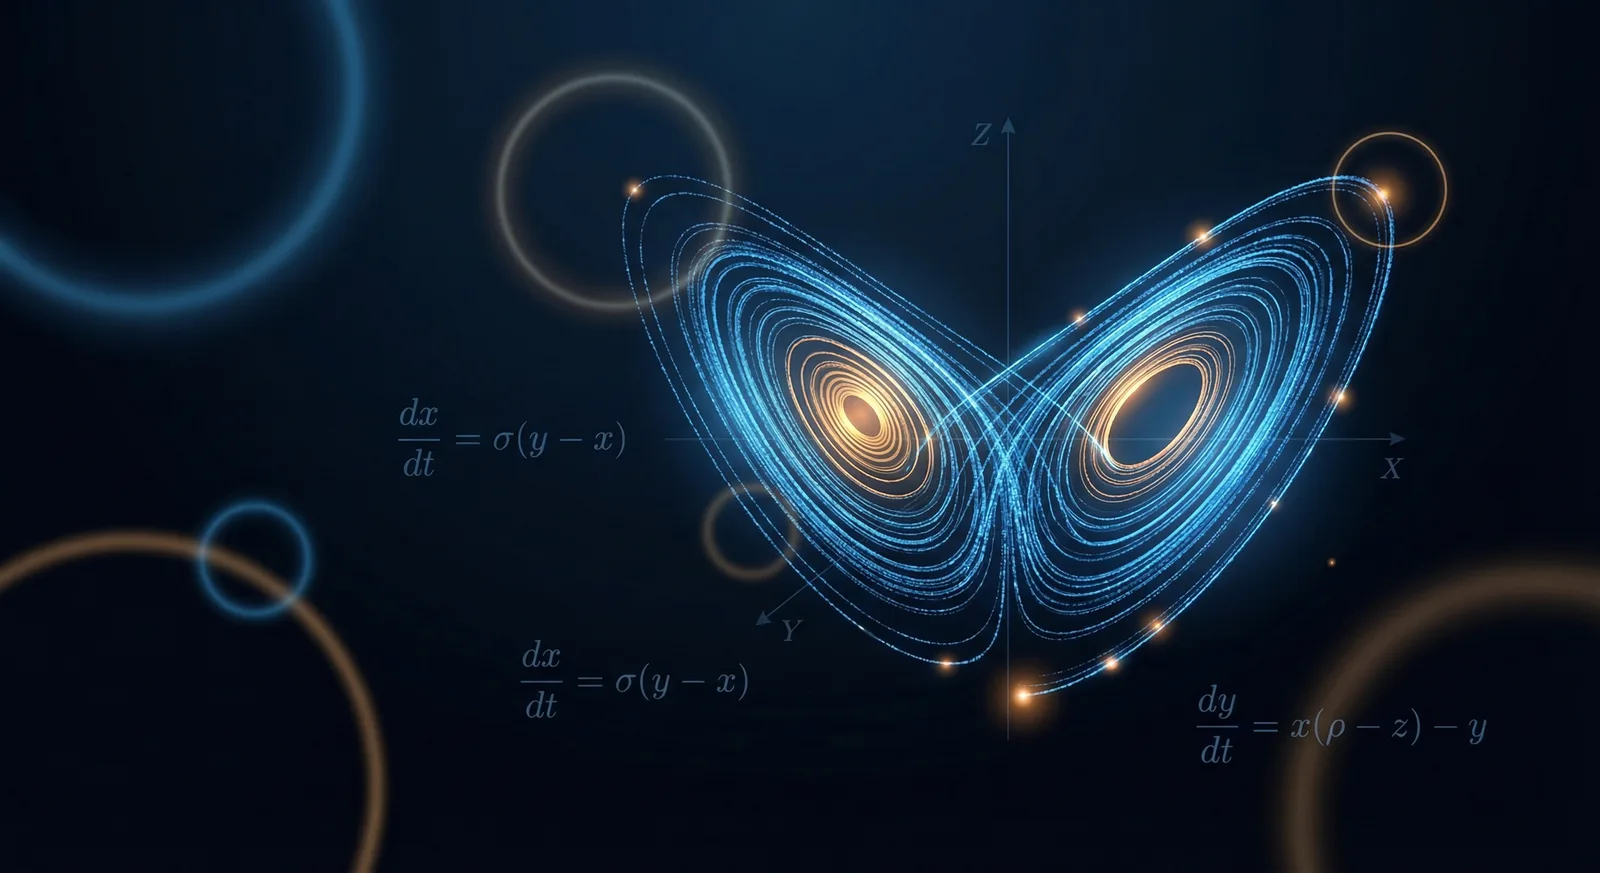
Animating Chaos: The Lorenz Attractor
The demo’s centerpiece is animating the Lorenz Attractor—that famous butterfly-shaped curve from chaos theory where tiny differences in initial conditions lead to dramatically different outcomes.
Here’s where Manim’s programmatic nature really shines. Grant:
- Uses ChatGPT to quickly get boilerplate SciPy code for solving the differential equations
- Creates a wrapper function to handle the numerical integration
- Generates curves from multiple initial conditions (differing by just 1/100,000th of a unit)
- Adds “glow dots” that follow the endpoints of each curve
- Sets up “updater” functions so the dots automatically track the curves as they’re drawn
- Animates the camera slowly panning in 3D to give depth to the visualization
- Implements trailing “tails” that fade out behind each dot
The result is a stunning visualization of sensitive dependence on initial conditions. You watch ten nearly-identical starting points diverge into completely different trajectories—the visual definition of chaos.
None of this required frame-by-frame animation. It’s all declarative: describe what you want, let the library figure out how to render it.
LaTeX Integration: Equations That Look Like Equations
For mathematical content, proper typesetting isn’t optional. Manim includes native LaTeX support, meaning you can write equations in standard mathematical notation and have them rendered beautifully.
equations = Tex(r"\dot{x} = \sigma(y - x)")
equations["x"].set_color(RED)
equations["y"].set_color(GREEN)
You can even index into equations by their mathematical symbols, allowing you to animate individual variables—highlight the x, flash the equals sign, indicate specific terms. Grant shows this off with the Lorenz system equations displayed in the corner while the attractor animates.
He also mentions MathPix, an OCR tool that can convert screenshots of equations directly into LaTeX code. The workflow becomes: see equation in paper, screenshot it, paste the LaTeX into Manim, animate.
Why This Matters for Educational Content
Here’s the broader point: Manim represents a fundamentally different relationship between creator and medium.
Traditional animation treats visuals as artifacts to be manually crafted. Manim treats them as computable outputs of precise specifications. This isn’t just about efficiency (though it’s dramatically more efficient for mathematical content). It’s about expressiveness.
When your animation is code:
- Consistency is automatic. Define a style once, apply it everywhere.
- Changes propagate. Adjust a parameter, and every dependent animation updates.
- Complexity is manageable. A 10,000-line scene is just code—version controlled, searchable, refactorable.
- Precision is exact. No “close enough” positioning. Mathematical relationships are mathematically correct.
For anyone creating educational content—especially in STEM fields—this is transformative. The bottleneck shifts from “can I animate this?” to “can I describe this mathematically?”
The Accessibility Problem
So far, we’ve seen what Manim can do in the hands of its creator. But what about the rest of us?
Grant has over a decade of experience with a tool he built himself. He knows every function, every trick, every workaround. For newcomers, Manim can feel overwhelming: unfamiliar syntax, unclear documentation (especially for his personal version), and a steep learning curve in both Python and mathematical visualization.
The irony isn’t lost on anyone: a tool designed to make math more accessible is itself not particularly accessible.
This is where modern AI assistants become genuinely useful. In Part 2, we’ll show you how to use Claude to bridge that gap—not as a replacement for learning, but as an accelerator. We’ll walk through using AI to:
- Translate your visualization ideas into working Manim code
- Understand and adapt examples from Grant’s GitHub repository
- Debug issues when animations don’t behave as expected
- Build increasingly complex scenes without getting lost in documentation
The combination of Manim’s expressive power and AI’s ability to translate intent into code opens this tool up to a much wider audience. You don’t need to be Grant Sanderson. You just need a clear idea of what you want to visualize—and a good collaborator to help you get there.
Stay tuned.
Conclusion
Manim isn’t just animation software. It’s a philosophy: that mathematical ideas deserve mathematical precision in their presentation, and that code is the right medium for expressing that precision.
Grant Sanderson’s behind-the-scenes look reveals both the power of the tool and the thoughtfulness of the workflow built around it. From the interactive development environment to the universal transformation system to the chaos theory visualization—every piece is designed to make the gap between mathematical concept and visual explanation as small as possible.
Whether you’re an educator looking for better ways to explain complex ideas, a student wanting to visualize what you’re learning, or just someone who appreciates elegant tools—Manim is worth understanding.
And in Part 2, we’ll show you how to actually start using it.